Original Article from Goldman Sachs Asset Management
When History May Not Repeat
With US midterm elections nearing, investors are increasingly looking to polls, public sentiment, and history for insight into what November may bring. Midterms have usually favored the opposition party to the President, especially in the House of Representatives. In fact, the opposition party has picked up an average of 26 House seats since World War II. While the odds for Republicans to flip the House remain favorable, margins may stay slim given the fewer number of competitive seats today. In our view, politics may impact future policies, but its predictive signals for market performance remain limited.
Competitive Shifts
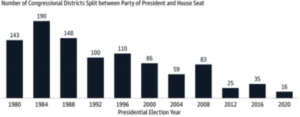
The likelihood that Republicans flip the House in November remains fairly high, albeit with wide tails. However, we believe today’s gains might not be as great in magnitude as past elections, making it difficult for history to repeat. Widespread partisan re districting and broader political polarization have shifted the battleground from general elections to primaries. Consequently, we see fewer competitive seats1 today, limiting the potential for seismic party shifts.
Source: The Cook Political Report and Goldman Sachs Asset Management
Tight Flips
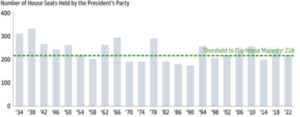
Still, the hurdle to flipping the House is much lower today. Republicans will only need to pick up five seats to flip control of the House, a threshold that has only been equal to or lower two other times in modern history. Meanwhile, in the Senate, candidate quality is paramount with fewer races overall. Ultimately, current polling suggests a strong likelihood of a divided government going forward.
Source: The American Presidency Project (UC Santa Barbara), Predictit, and Goldman Sachs Asset Management.
Mixed Markets
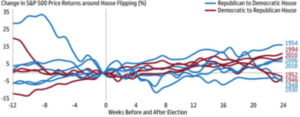
In our view, election outcomes may have implications for broader policies. But, for markets, the statistical strength of the relationship between elections and markets has historically been weak. We expect macro risks and fundamentals to be dominant drivers of market returns. As such, political enthusiasm may be best expressed through a vote, not a trade.
Source: Bloomberg and Goldman Sachs Asset Management.
Top Section Notes: As of September 30, 2022.
1A competitive seat is measured by the Congressional districts voting for a presidential nominee of one party and member of the House in another party. Middle Section Notes: As of September 30, 2022. Chart shows the number of sea ts in the House of Representatives that were held by the President’s party on US midterm election day. “Threshold to Flip House Majority” reflec ts the minimum number of party seats required to retain the majority in the House. Bottom Section Notes: As of September 30, 2022. Chart shows the S&P 50 0 price returns leading up to and following US elections in years where the House control flipped from one party to another. Data begins in 1 930 . The economic and market forecasts presented herein are for informational purposes as of the date of this document. There can be no assurance that the forecasts will be achieved. Past performance does not guarantee future results, which may vary.


 Invest Well. Manage Well. Live Well.
 Gary is a Financial Associate at Gleba & Associates, Inc., joining our team in June 2020. After graduating from Walsh College with a Bachelor’s Degree in Finance in 2013, he began his career at Raymond James Financial Services. He then moved to the world of banking, working as a banker with Chase Private Client and then as an Assistant Vice President, Financial Advisor with PNC Investments. Gary has expertise in all aspects of financial planning including investment management, higher education planning, life insurance, and long-term care insurance needs analysis. When he gets away from the office, he loves to spend time with his wife, Lauren, and two daughters, Hadley and Harper. He enjoys woodworking, boating, summer weekends at the family cottage, spending time outdoors and traveling.
 Conor is a Financial Associate at Gleba & Associates, Inc., where he started in 2018. Conor has prior experience in the financial planning industry, as well as in the insurance industry. His high level of understanding insurance and financial products helps him in assessing the needs of our clients. He holds a Bachelor of Science degree in Business Administration with a concentration in Finance from the University of Detroit Mercy. You can often find Conor playing soccer or walking with his two dogs Milo, and Ellie. He is also an avid follower of the Detroit Tigers, Detroit Red Wings and his alma mater, the University of Detroit Mercy Titans.
 Lorie Heitzer is our Financial Associate at Gleba & Associates, Inc., where she has been a valuable employee for more than a decade! In her current role, Lorie assists with client reviews, implements client financial planning, and handles preparation of investment paperwork. During her time with Gleba & Associates, Lorie has earned her Series 6 (Investment Company Variable Contracts Representative), 63 (Uniform Securities Agent) and Life Insurance Licenses, allowing her to move into her current role where she assists clients in both of these areas. Lorie and her husband Bill, along with their daughters Lauren and Alexandria, and sons-in-law, Andrew & Joe, enjoy golf and make it a family event whenever possible. Her tenure at Gleba & Associates speaks volumes to her passion for the firm’s family atmosphere and her dedication to our clients and their financial and insurance needs.
 Terri is the Service Manager at Gleba & Associates, Inc., Joining the team in April, 2015. In her role, she handles client service requests and underwriting. Terri’s previous experience in 401(k) Retirement Plans, Payroll and Human Resource Administration is invaluable, allowing Gleba & Associates to grow and run efficiently. This is knowledge that can also assist our small business clients as they grow their businesses. Terri enjoys spending time with family, which includes her husband, Gerry and her two children, Vincent and Genna. She loves the outdoors and camping with family in their RV. Terri looks forward to continuing the high level of customer service you have come to expect from Gleba & Associates!
 Michael is the Marketing Manager at Gleba & Associates, Inc., where he began in August 2017. In his position, Michael creates and develops marketing strategies to enhance the image of Gleba & Associates, and helps maximize the Client-Advisor relationship. He is also in charge of company events, seminars, and educational workshops. Michael has a Bachelor of Applied Arts Degree in Integrative Public Relations from Central Michigan University. When he is not in the office, Michael can most likely be found playing billiards, playing poker, on the tennis court, or rooting on the Utica Unicorns baseball team. Michael stays active by going to the gym and going to the dog park with his Labrador-mix, Milton. His approachable attitude, along with experience in marketing, communications, and social media, makes him a valuable asset to the Gleba & Associates team.
 Moiz is our Financial Associate at Gleba & Associates, Inc., where he began in 2013 after working for Bank of America and Thomson Reuters in various financial roles. In his position, Moiz assists in the research of financial solutions in order to meet client’s needs, conducts client reviews, provides insurance quotes, offers detailed financial plans, and delivers follow-up services to our clients. Before moving to the United States in 2004, Moiz grew up in rural India, where he was raised in a family of entrepreneurs. This allowed him to quickly learn the value of financial investment. Moiz holds a Bachelor of Commerce Degree in Accounting from Gujrat University and a B.B.A. in Management and an MBA from Walsh College of Accountancy and Business Administration, where he was elected as a member of Delta Mu Delta, the International Honor Society in Business Administration in recognition of high scholastic attainment. Moiz enjoys spending time with his wife, Tasneem, son, Taha, and family. He also loves playing tennis and rebuilding computers. His expertise in the areas of banking, mortgage and taxation helps to provide our clients with distinct portfolio advice as well as overall financial direction and growth.